

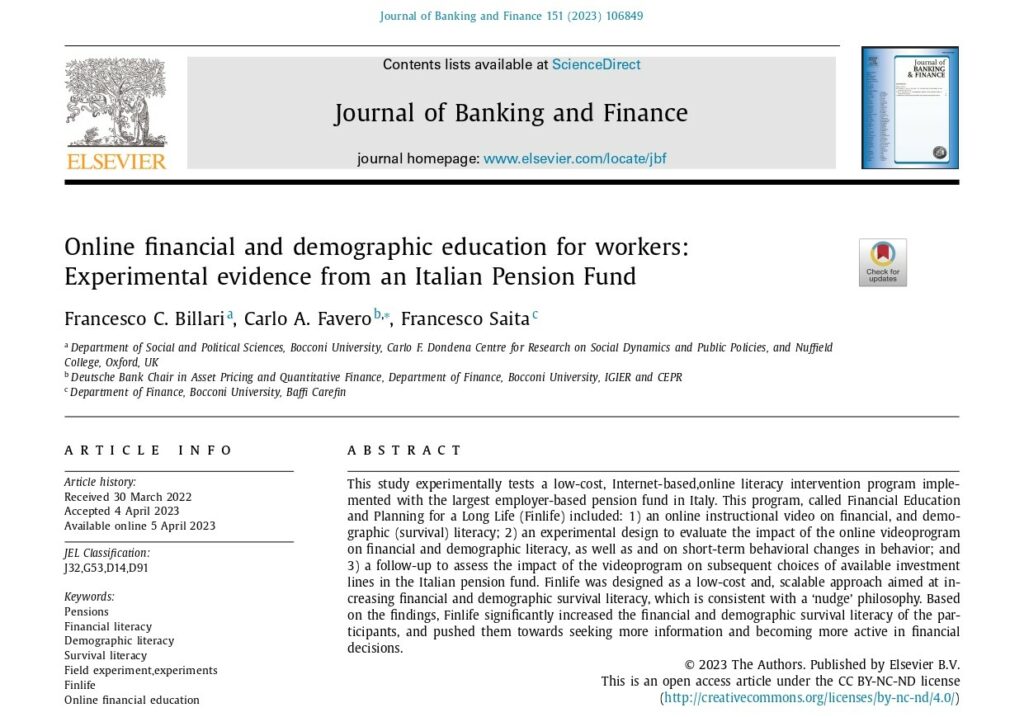
Billari et al. (2023) examine the effects of an online financial education program for workers. They find that a financial education program produced a statistically significant, homogenous, and persistent increase in financial and demographic literacy, a stronger interest for estimating individual pension positions, and modifications in actual behavior. Further, they found a significant effect on the migration of workers toward higher-risk, higher-return investment options. This effect was larger for younger workers, precisely those for whom a very low risk-very low return asset allocation would be the most detrimental over the long term.

A financial education program was established at a Fortune 25 company in 2022. From post program assessments, the program was deemed effective both in terms of knowledge and behavior changes. Employees who engaged in the program were more likely to adopt savvy financial habits in the future, such as saving for both emergencies and retirement, planning for future expenses, looking for information before making huge financial decisions, and asking for advice from a financial counselor.
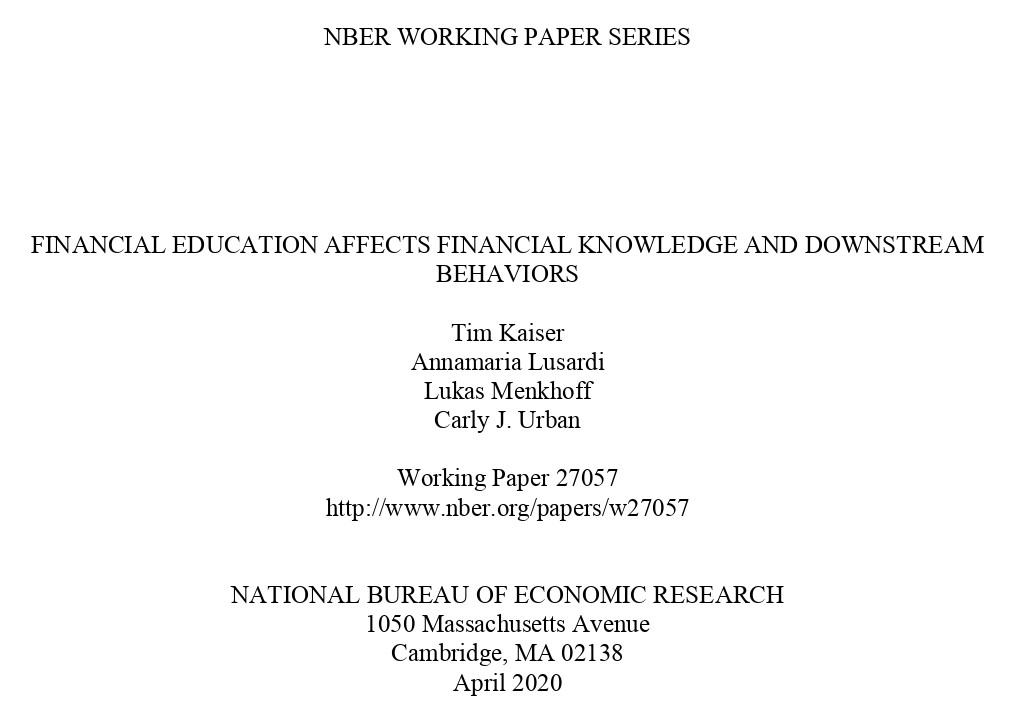
Kaiser et al. (2022) perform a meta-analysis of 76 randomized experiments with a sample size over 160,000 individuals that shows financial education programs have, on average, positive causal effects on financial knowledge and financial behaviors.
Ghafoori et al. (2021) examine a large-scale program administered by AustralianSuper, the largest superannuation pension fund in Australia. The fund provides 90-minute in person retirement seminars aimed at pre-retiree fund members. The authors find that seminar attendees increased their voluntary contributions but also displayed more sophisticated portfolio strategies.
Bernheim and Garrett (2003) utilize a household survey and find that the provision of employer-based financial education is associated with a higher propensity to save, for everyday expenses as well as for retirement.

This is a sample presentation that covers some financial topics. The file is intended to provide a sense of the type of presentations delivered. Some slides will have graphics to discuss, some slides will be more content heavy. Every attendee will receive this file in at least an online version so they can take it with them and revisit it as needed. We encourage collaboration with you so that we can include information and/ or slides relative to your organization’s financial benefits.
This chart illustrates the benefits of diversification. This chart compares many different asset classes over time.
Could you, or anyone, fill out next year’s column?
Is this random, or are there patterns?
The average Bull Market lasts 6.6 years. The average Bear market lasts 1.3 years. Continue to dollar cost average contributions through peaks and valleys.
Do you think you could predict the starting and ending points?
Can you withstand the recession drawdowns? If not, revisit your asset allocation.
51% of large-cap domestic equity mutual funds underperformed the S&P 500 in 2022. Over 90% of large-cap mutual funds underperform the S&P 500 on a 10, 15, and 20-year basis.
Do you think you could pick the funds that beat an index BEFORE they do?
Are you a passive investor or an active investor?
As of 2022, for all U.S. small-cap stock funds, over 97% of recent former leaders weren’t able to produce above-median returns by the end of the second five-year period. Just because a mutual fund does well in a given year, it does not mean that mutual fund will do well in subsequent years.
How actively do you want to consistently screen mutual funds?
How often do you need to adjust your asset allocation?
Annual stock market returns are a bell-shaped curve, a normal distribution. Notice that the peak of the curve is in positive territory. The market has grown in 69% of all years on record and declined in 31% of years on record.
What percentage of your investments should be invested in stocks?
When was the last time you adjusted your asset allocation?
The Dow Jones Industrial Average has risen annually over 60% of the time. This probability of an increase is nearly unchanged regardless of what the Dow Jones index did the prior year.
What role does recency bias play in your investment decisions?
Does the financial entertainment news lead you to believe these statistics?
Past performance is no guarantee of future results. The files provided are presented for informational purposes only. No tax, financial, legal, or investment decision should be made solely based on these files. Consult your tax, financial, legal, or investment professionals.